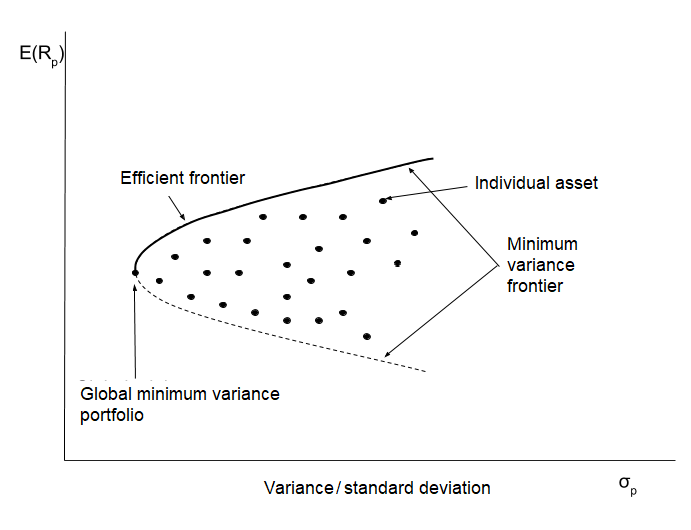
A depiction of various combinations of risky assets for a portfolio construction, each with its specific risk-return characteristics. These characteristics are depicted on a graph (the frontier) featuring expected returns vs. standard deviation: the portfolio expected return as the y-axis and portfolio standard deviation as the x-axis. The minimum variance frontier plots all coordinates of that produce minimum variance for a given level of expected return.

The above graph shows shows all possible return-risk combinations (points) in the form of the minimum variance frontier, taking into consideration the so-called investment opportunity set– i.e., portfolios with varying weights of all the individual assets (including risky assets, risk free assets, etc.) available to the community of investors in a given market. For a certain return, a portfolio will produce the minimum variance (risk) in the investment opportunity set. Overall, the entire set of combinations constitute the curve connecting such portfolios with minimum variance.
The portfolio with the least risk (variance) in the set of portfolios is known as the global minimum-variance portfolio. The section of minimum variance frontier that forms above the global minimum variance portfolio consists only of the portfolios with the highest returns for a certain variance, i.e., the efficient frontier (for risk-averse investors).


