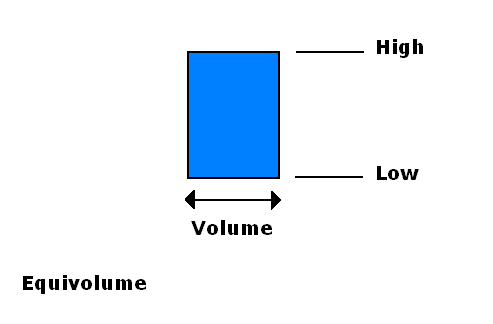
A technical analysis tool that charts prices in their relation to volumes. It combines price and volume in a two-dimensional box the top line of which is the high for the observation period and the bottom line is the low for that period. The width of the box is the volume for the period. The following figure illustrates the shape of an equivolume box:

The equivolume box graphically embodies the supply and demand for the security in question during a particular observation period (trading period). Tall and narrow boxes imply light volume with big changes in price, while short and wide boxes betray heavy volume with small changes in price. The former tend to be the case at turning points, whereas the latter tend to occur in established trends.
Equivolume was introduced by Richard W. Arms, Jr.


