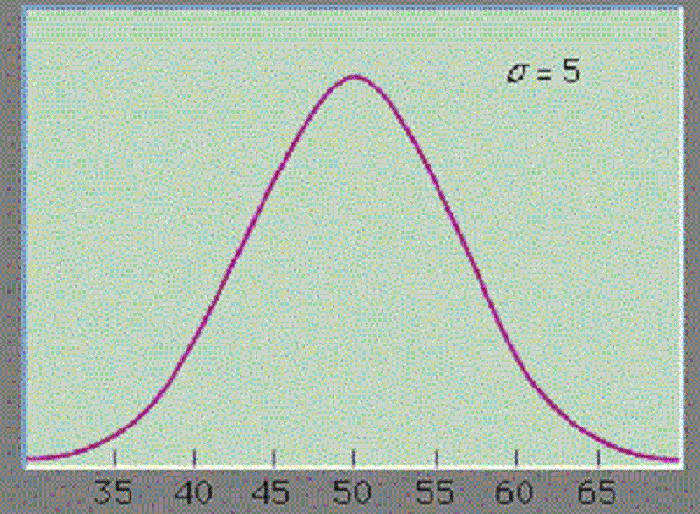
A bell-shaped curve that depicts a continuous probability distribution for a real-valued random variable. For a range of measurement values, the random variable is assumed to follow a normal distribution with an equal number of measurements above and below a specific mean (central tendency). Normal distribution (or also, Gaussian distribution) is the most popular distribution function for independent, randomly generated or developed variables. It fits the probability distribution of many events, particularly the distribution of returns on an investment or distribution of asset prices.
The below graph represents a normal probability distribution with a mean (μ) of 50 and a standard deviation (σ) of 5.


