Search
Generic filters
Filter by Categories
Accounting
Banking

Technical Analysis


Support and Resistance


The following two figures show an uptrend and downtrend, respectively. Figure (1) shows rising support and resistance levels in an uptrend. Points B and D are support levels, marked by previous troughs, while points A and B are resistance levels, marked by previous peaks.
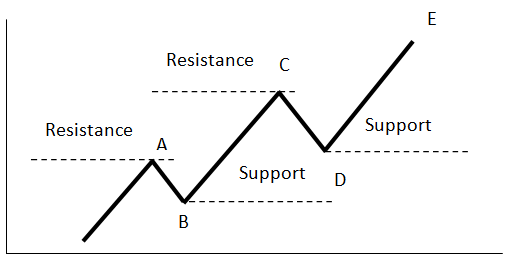
Support and Resistance

In figure (2) points B and D are resistance levels, while points A and B are support levels, in a downtrend.
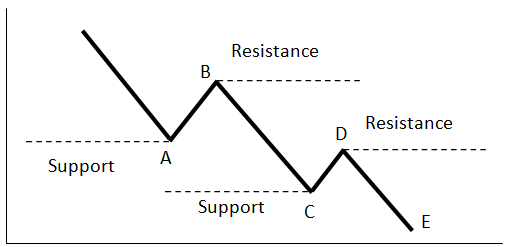
Support and Resistance


Tutorials
This section contains quite a vast collection of easy-to-understand explanatory manuals, practical guides, and best practices how-tos covering the main themes of this ...
Watch on Youtube
Remember to read our privacy policy before submission of your comments or any suggestions. Please keep comments relevant, respectful, and as much concise as possible. By commenting you are required to follow our community guidelines.

Comments


    Leave Your Comment

    Your email address will not be published.*