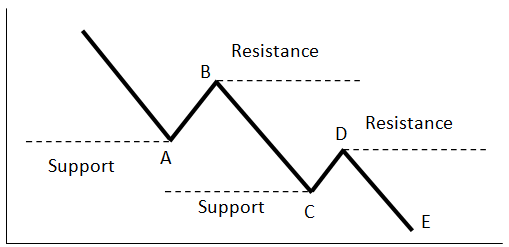


The following two figures show an uptrend and downtrend, respectively. Figure (1) shows rising support and resistance levels in an uptrend. Points B and D are support levels, marked by previous troughs, while points A and B are resistance levels, marked by previous peaks.
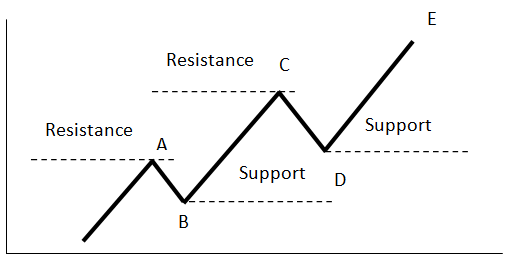
In figure (2) points B and D are resistance levels, while points A and B are support levels, in a downtrend.