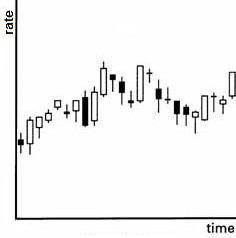
A charting method that depicts currency market behavior over some period of time using the high rate, low rate, and closing rate. In this sense, it is similar to bar charting, but differs in that a candlestick always includes the opening rate. Candlestick chart patterns emphasize the paradigm that past rates transmit information about futures rates. A candlestick chart is constructed by plotting the and high rates on a thin bar, and a box is used to represent the opening and closing rates. This box is made up of a horizontal mark at both the opening and closing rates. The two horizontal marks create a rectangle box known as the real body of the candlestick. The following depiction illustrates a typical candlestick chart:

This charting tool was originally introduced in Japan in the mid-1600s and was helpful to the trading of rice futures. It has many variations including: doji candlestick, dragon doji candlestick, reverse candlestick, etc.


